
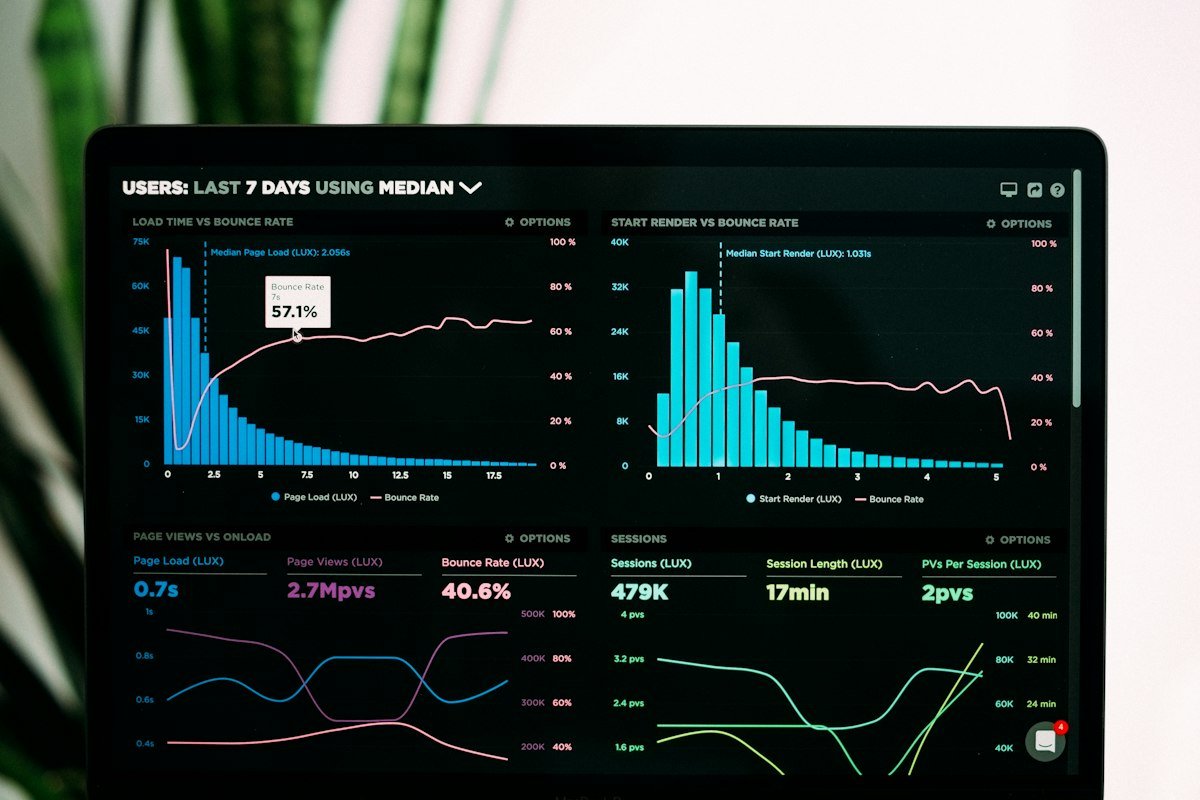
In modern digital marketing, vanity metrics like raw impressions and unsegmented traffic can be deceptively reassuring. A website generating 100,000 visits from informational queries with zero commercial intent generates less revenue than a focused landing page capturing 2,000 bottom-of-funnel buyers. SEO analytics provides the lens to distinguish between useless noise and profitable organic momentum.
Achieved across 6-month technical search sprints.
Sub-two-second Largest Contentful Paint (LCP) accelerates crawl velocity.
Positions 1 through 3 capture over half of all organic search volume.
What is SEO Analytics & Why It Matters to Leadership
SEO analytics is the systematic practice of gathering, querying, and modeling organic performance data from platforms like Google Search Console (GSC), Google Analytics 4 (GA4), Ahrefs, and server log files. The primary objective is not merely monitoring positions—it is understanding user intent, isolating crawl bottlenecks, and proving bottom-line organic Return on Investment.

The 6 Essential Metrics You Must Measure
1. Organic Conversions & Assisted Revenue
Tie organic search sessions to specific GA4 key events (form submissions, calls, orders). Measure multi-touch attribution to see how informational blog posts assist eventual conversions.
2. Non-Branded Organic Traffic Velocity
Exclude brand name queries in GSC to isolate genuine search discoverability. If non-branded queries are increasing, your content architecture is outranking industry rivals.
3. Average Click-Through Rate (CTR) by Position
Ranking in position #1 yields an average 28.5% CTR; position #3 drops to ~11%. Compare your page CTR against industry benchmarks to optimize title tags and meta descriptions.
4. Crawl Health & Indexation Coverage
Monitor Googlebot crawl budget allocation in Search Console. Identify "Crawled - currently not indexed" warnings to resolve thin content and pagination bloat.

Step-by-Step: Assembling an Executive SEO Dashboard
- Connect GSC to Looker Studio: Pull daily query-level impressions, clicks, CTR, and average position into an automated dashboard.
- Segment Query Classes: Create regex filters separating Brand queries (`dm30|digital marketing 30`) from Non-Brand commercial topics.
- Layer GA4 Conversion Events: Cross-reference landing page organic sessions with transaction revenue to calculate Organic ROI per content pillar.
- Monthly Anomaly Detection: Run week-over-week comparisons to spot sudden ranking declines caused by cannibalization or algorithmic adjustments.
Executive Takeaway
Stop reporting on raw keyword rankings. Leadership cares about pipeline velocity, customer acquisition efficiency, and revenue attributable to search. Anchor every SEO review around conversions and gross margin contribution.